Back to Catalog
Nutrient & Health Score Comparison
Side-by-side comparative analysis of FMCG product formulation, sugar, trans fat, and INS additives.
Nutrients are normalized per 100g / 100ml. Data is referenced directly from statutory packaging declarations.
Scroll horizontally →| Compare Metrics | Product 1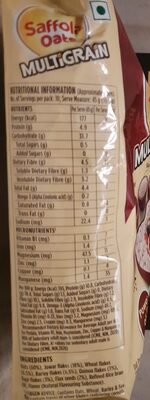 | Product 2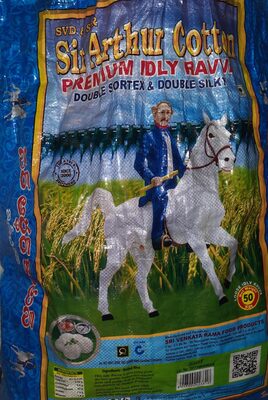 |
|---|---|---|
| Health score | — | — |
| HFSS status | No HFSS flag recorded; not a compliance determination. | No HFSS flag recorded; not a compliance determination. |
| Declared allergens | Gluten | No declarations available; not an allergen-free claim. |
| Added sugars | 0g | 0g |
| Saturated fat | 1.78g | — |
| Sodium | 49.78mg | — |
| Dietary status | Vegetarian | Vegetarian |
| Ingredients | Read indexed statementOats (60%), Jowar flakes (18%), Wheat flakes (6.5%), Barley flakes (6.5%), Quinoa flakes (3%). Ragi flakes (3%), Flax seeds (2%), Refined Rice bran Oil, Flavor (Natural Flavouring Substance). | Read indexed statementBoiled Rice |
| Barcode (GTIN) | 8901088704625 | 8908004423318 |
| Full Health Audit | View complete audit → | View complete audit → |