Back to Catalog
Nutrient & Health Score Comparison
Side-by-side comparative analysis of FMCG product formulation, sugar, trans fat, and INS additives.
Nutrients are normalized per 100g / 100ml. Data is referenced directly from statutory packaging declarations.
Scroll horizontally →| Compare Metrics | Product 1 | Product 2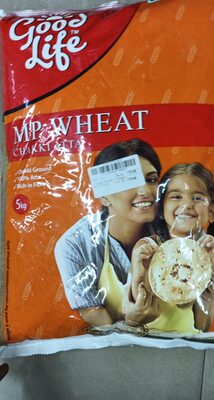 |
|---|---|---|
| Health score | — | — |
| HFSS status | HFSS flag recorded
| Unavailable |
| Declared allergens | GlutenNutsSoySoybeansTree Nuts | Gluten |
| Added sugars | 18.9g | — |
| Saturated fat | 3.5g | — |
| Sodium | 143.3mg | — |
| Dietary status | Vegetarian | Vegetarian |
| Ingredients | Read indexed statementOATS (16.9%), SUGAR, WHEAT FLAKES (14.3%), CORN GRITS (10.5%), DRIED PAPAYA (8.5%), BARLEY FLAKES (6.8%), RICE (6.3%), LIQUID GLUCOSE, BLACK RAISINS (5%), SLICED ALMONDS (5%), DRIED APPLE (4%), MALT, IODIZED SALT, NATURE DENTICAL FLAVOUR HONEY, CITRIC ACID (INS 330), SOYA LECITHIN (INS 322 (i), TOCOPHEROL (INS 307b). | Unavailable |
| Barcode (GTIN) | 8903363010025 | 8902901027990 |
| Full Health Audit | View complete audit → | View complete audit → |