Back to Catalog
Nutrient & Health Score Comparison
Side-by-side comparative analysis of FMCG product formulation, sugar, trans fat, and INS additives.
Nutrients are normalized per 100g / 100ml. Data is referenced directly from statutory packaging declarations.
Scroll horizontally →| Compare Metrics | Product 1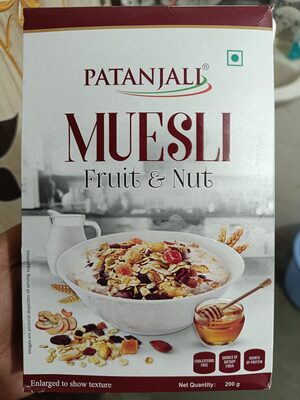 | Product 2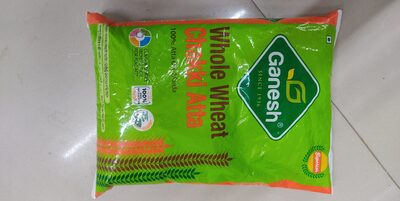 |
|---|---|---|
| Health score | — | — |
| HFSS status | No HFSS flag recorded; not a compliance determination. | Unavailable |
| Declared allergens | GlutenNutsTree Nuts | Gluten |
| Added sugars | 5.15g | — |
| Saturated fat | — | — |
| Sodium | — | — |
| Dietary status | Unknown | Vegetarian |
| Ingredients | Read indexed statementWheat Flakes (28.68%), Corn Flakes (24.93%), Fruits & Nuts {Black Raisins (4%), Dried Pineapple (4%), Dried Papaya (4%), Almond Slice (3.8%), Dried Apple (3.5%)}, White oats (17.5%), Rice Flakes (5%), Invert Sugar, Honey (1%), Liquid Glucose and Antioxidant (INS 320) | Unavailable |
| Barcode (GTIN) | 8906032019138 | 8906010070113 |
| Full Health Audit | View complete audit → | View complete audit → |